Note
Access to this page requires authorization. You can try signing in or changing directories.
Access to this page requires authorization. You can try changing directories.
Azure Monitor now supports native ingestion of OpenTelemetry Protocol (OTLP) signals. You can send telemetry data directly from OpenTelemetry-instrumented applications to Azure Monitor.
Important
- This feature is in preview. Preview features are provided without a service-level agreement and aren't recommended for production workloads.
- For more information, see Supplemental Terms of Use for Microsoft Azure Previews.
Overview
Azure Monitor can receive OTLP signals through three ingestion mechanisms:
- OpenTelemetry Collector - Send data directly to Azure Monitor cloud ingestion endpoints from any OTel Collector deployment.
- Azure Monitor Agent (AMA) - Ingest data from applications running on Azure virtual machines (VMs), Virtual Machine Scale Sets, or Azure Arc-enabled servers.
- Azure Kubernetes Service (AKS) add-on - Collect telemetry from containerized applications in AKS clusters. See Enable Azure Monitor OpenTelemetry for Kubernetes clusters for details.
This article covers the OTel Collector method of collecting OTLP signals.
Prerequisites
- Azure subscription: If you don't have one, create an Azure subscription for free.
- OpenTelemetry SDK instrumented application (any supported language).
- For OpenTelemetry Collector deployments: Collector version 0.132.0 or higher with the Azure Authentication extension.
Set up OTLP data ingestion
You can configure OTLP data ingestion in Azure Monitor by using one of two approaches. The Application Insights-based approach is recommended for most scenarios as it automates resource creation and enables built-in troubleshooting experiences.
Option 1: Create an Application Insights resource with OTLP support (Recommended)
This method automatically provisions all required Azure resources and configures their relationships. You can use Application Insights for application performance monitoring, distributed tracing, and failure analysis.
Register the Application Insights OTLP preview features and provider.
az feature register --name OtlpApplicationInsights --namespace Microsoft.Insights
az feature list -o table --query "[?contains(name, 'Microsoft.Insights/OtlpApplicationInsights')].{Name:name,State:properties.state}"

az provider register -n Microsoft.Insights
In the Azure portal, create a new Application Insights resource.
On the Basics tab, select the Enable OTLP support checkbox.
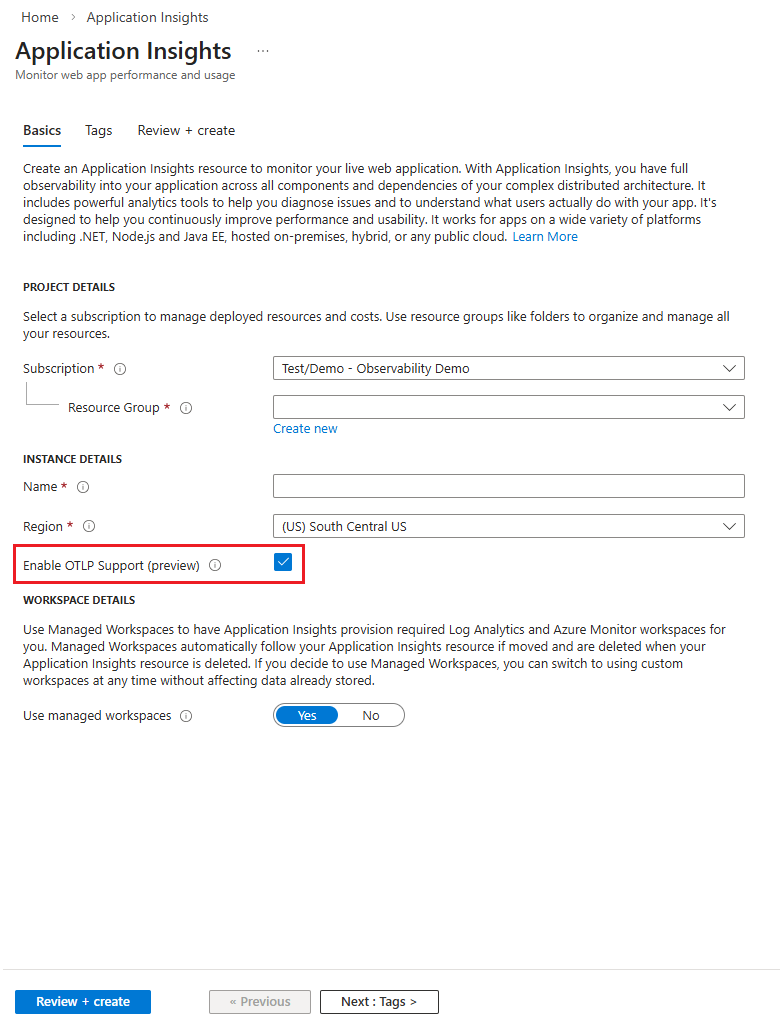
Complete the resource creation process.
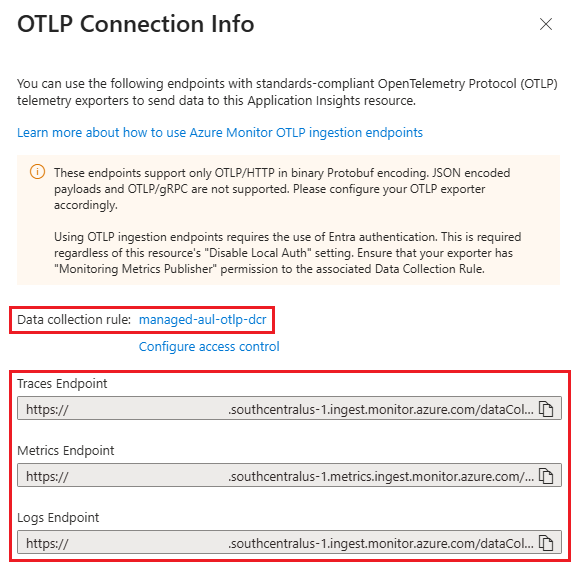
After deployment, go to the Overview page of your Application Insights resource.
In the OTLP Connection Info section, copy the following values:
- The Data Collection Rule (DCR) resource ID
- The endpoint URLs for traces, logs, and metrics (if you're using OpenTelemetry Collector)


Proceed to Configure your OpenTelemetry Collector.
Option 2: Manual resource orchestration
This option requires you to manually create and configure Data Collection Endpoints (DCE), Data Collection Rules (DCR), and destination workspaces. Use this approach when you need custom configurations or want to reuse existing resources.
Create destination workspaces
If you don't have existing workspaces, create the following resources in the same Azure region:
- Log Analytics workspace (LAW) - Stores log and trace data
- Azure Monitor workspace (AMW) - Stores metrics data
Record the resource IDs of both workspaces for later use.
(Optional) Create an Application Insights resource
To enable Application Insights troubleshooting experiences with your OTLP data:
- Create an Application Insights resource in the same region as your workspaces.
- Clear the Enable OTLP support checkbox to avoid creating duplicate resources.
- Copy the Application Insights resource ID.
Note
If you skip this step, you need to modify the ARM template in the next section to remove Application Insights references.
Deploy the Data Collection Endpoint and Rule
- In the Azure portal, search for Deploy a custom template and select it.
- Select Build your own template in the editor.
- Copy the template content from the Azure Monitor Community repository.
- Paste the template into the editor and update the parameters with your workspace resource IDs and (optionally) Application Insights resource ID.
- In this example, the stream name from the community DCR template is used to create the URL. You can optionally change the stream name in the DCR definition and match it when creating the DCE name. The stream name should start with
Custom-Metrics-followed by a letter and then any combination of alphanumeric characters,-, and_. - Set the location to match your workspace region.
- Review and create the deployment.
- After deployment completes, navigate to the created DCR and copy its resource ID from the Overview page.
Configure your OpenTelemetry Collector
Note
- The following Collector configuration uses components from the OpenTelemetry Collector Contrib project and the Azure Authentication Extension to send telemetry data to Azure Monitor. You can also build a custom distribution by using the OpenTelemetry Collector Builder with components from the core and contrib repositories.
- Support for these open-source components is provided exclusively through community channels. To submit bug reports, request new features, or report other issues, create a new issue in the public repository.
- Azure support is available for Azure services and resources, including Application Insights, Azure Monitor, and Log Analytics workspaces, as well as Data Collection Rules and Data Collection Endpoints.
Configure Microsoft Entra authentication
The OpenTelemetry Collector requires Microsoft Entra authentication to send data to Azure Monitor.
For Azure VMs and Virtual Machine Scale Sets:
- Enable system-assigned managed identity on your compute resource.
- Assign the Monitoring Metrics Publisher role to the managed identity.
- To use the system-assigned identity, leave the
managed_identitysection blank in your collector configuration.
For non-Azure environments:
Configure the Azure Authentication extension in your collector with an appropriate Microsoft Entra identity:
extensions:
  azureauth/monitor:
    managed_identity:
      client_id: "xxxxxxxx-xxxx-xxxx-xxxx-xxxxxxxxxxxx"  # Your identity client ID
    scopes:
      - https://monitor.azure.com/.default
For workload identities, service principals, or other Microsoft Entra identities, provide the client_id of the identity that needs to authenticate.
Grant permissions to the Data Collection Rule
The identity your collector uses needs permission to write data to your DCR:
Go to your DCR in the Azure portal.
Select Access control (IAM) in the left navigation.
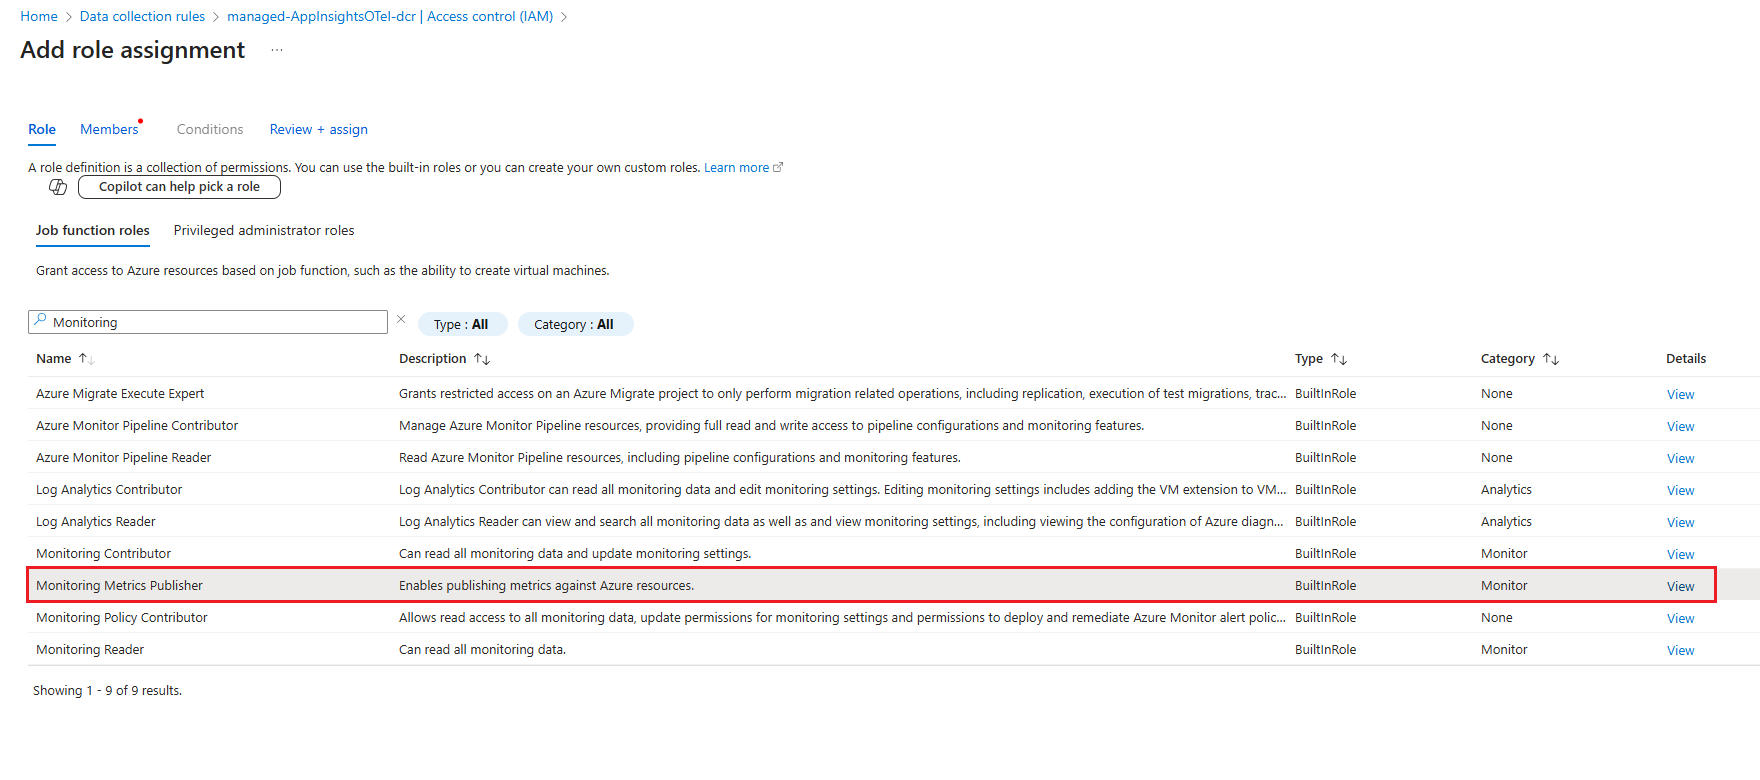
Select Add > Add role assignment.

Select Monitoring Metrics Publisher and select Next.
For Assign access to, select User, group, or service principal.
Select Select members and choose your application or managed identity.
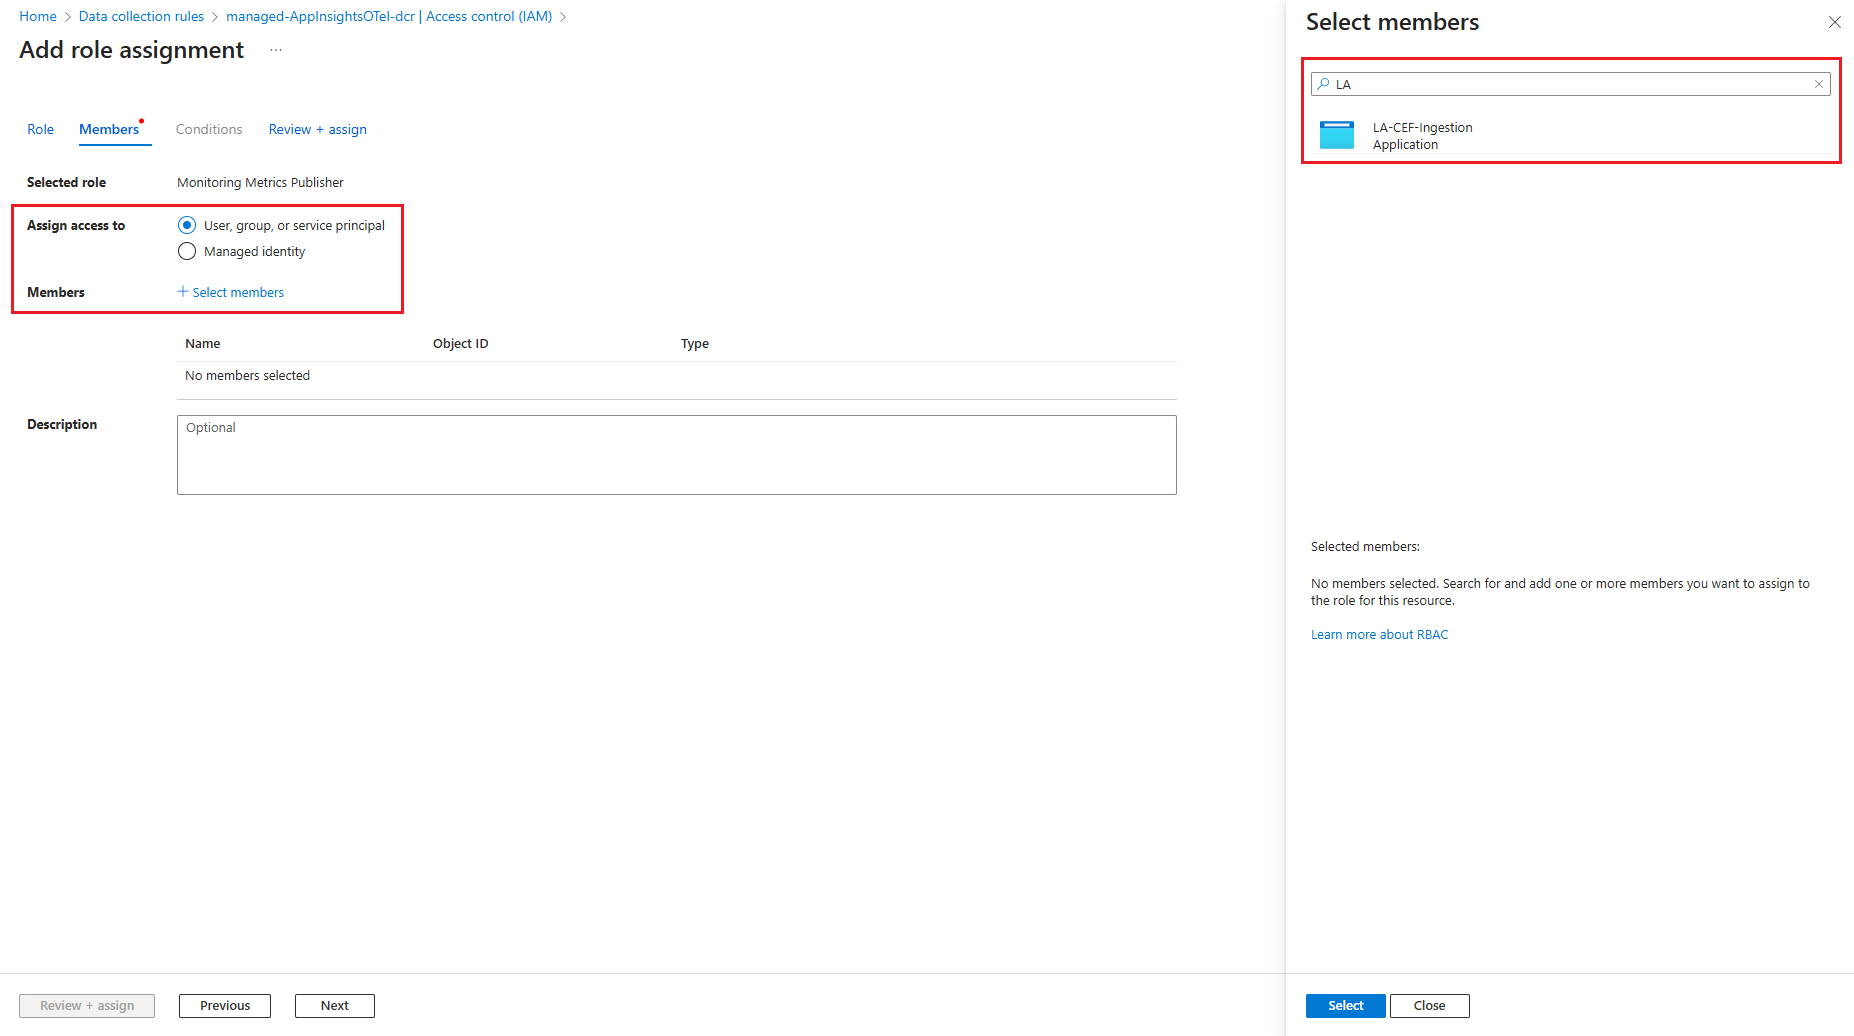
Select Review + assign to save the role assignment.


Construct endpoint URLs
If you created your resources by using the Application Insights method, you already have the endpoint URLs from the OTLP Connection Info section. Skip to Update collector configuration.
You can optionally change the stream name in the Data Collection Rule (DCR) definition, but the stream name used in the DCR must exactly match the stream name used when constructing the Data Collection Endpoint (DCE) URL, and this match is case-sensitive. The stream name must start with Custom-Metrics-, followed by a letter, and then any combination of alphanumeric characters, hyphens (-), or underscores (_). If you change the stream name, you must update all references to the stream name in the DCR template and ensure the DCE URL uses the same value.
For manually orchestrated resources, construct the endpoint URLs:
Go to your Data Collection Endpoint in the Azure portal.
Select JSON View from the Overview page.
Copy the
logsIngestionandmetricsIngestionendpoint values:"logsIngestion": { "endpoint": "https://<name>.<location>-1.ingest.monitor.azure.com" }, "metricsIngestion": { "endpoint": "https://<name>.<location>-1.metrics.ingest.monitor.azure.com" }Go to your Data Collection Rule and copy the Immutable ID from the Overview page.
Construct your endpoint URLs by using this pattern:
Metrics endpoint:
https://<metrics-dce-domain>/datacollectionRules/<dcr-immutable-id>/streams/Custom-Metrics-OTEL/otlp/v1/metricsLogs endpoint:
https://<logs-dce-domain>/datacollectionRules/<dcr-immutable-id>/streams/Microsoft-OTLP-Logs/otlp/v1/logsTraces endpoint:
https://<logs-dce-domain>/datacollectionRules/<dcr-immutable-id>/streams/Microsoft-OTLP-Traces/otlp/v1/tracesNote
The traces endpoint uses the logs DCE domain.
Update collector configuration
Configure your OpenTelemetry Collector with the authentication extension and Azure Monitor endpoints. Here's a sample configuration:
receivers:
  otlp:
    protocols:
      grpc:
        endpoint: localhost:4317
      http:
        endpoint: localhost:4318

processors:
  batch:

extensions:
  azureauth/monitor:
    use_default: true
    scopes:
      - https://monitor.azure.com/.default

exporters:
  otlphttp/azuremonitor:
    traces_endpoint: "https://<logs-dce-domain>/datacollectionRules/<dcr-immutable-id>/streams/<strong>Microsoft-OTLP-Traces</strong>/otlp/v1/traces"
    logs_endpoint: "https://<logs-dce-domain>/datacollectionRules/<dcr-immutable-id>/streams/<strong>Microsoft-OTLP-Logs</strong>/otlp/v1/logs"
    metrics_endpoint: "https://<metrics-dce-domain>/datacollectionRules/<dcr-immutable-id>/streams/microsoft-otelmetrics/otlp/v1/metrics"
    auth:
      authenticator: azureauth/monitor

service:
  extensions:
    - azureauth/monitor
  pipelines:
    traces:
      receivers: [otlp]
      processors: [batch]
      exporters: [otlphttp/azuremonitor]
    metrics:
      receivers: [otlp]
      processors: [batch]
      exporters: [otlphttp/azuremonitor]
    logs:
      receivers: [otlp]
      processors: [batch]
      exporters: [otlphttp/azuremonitor]
Important
Application Insights experiences, including prebuilt dashboards and queries, expect and require OTLP metrics with delta temporality and exponential histogram aggregation.
If you emit OTLP metrics from an OpenTelemetry SDK, configure your OTLP exporter to produce the metrics with delta temporality. For more information, see Metrics Exporters - OTLP.
If the OpenTelemetry collector receives OTLP metrics in cumulative temporality, add
processors: [cumulativetodelta]to the metrics section of the OpenTelemetry collector config to convert to delta. For more information, see cumulativetodeltaprocessor on GitHub.