Note
Access to this page requires authorization. You can try signing in or changing directories.
Access to this page requires authorization. You can try changing directories.
This guide describes how to use Azure Monitor to monitor the health and performance of virtual machines and their workloads. It includes collection of telemetry critical for monitoring and analysis and visualization of collected data to identify trends. It also shows you how to configure alerting to be proactively notified of critical issues.
Note
This guide describes how to implement complete monitoring of your enterprise Azure and hybrid virtual machine environment. To get started monitoring your first Azure virtual machine, see Monitor Azure virtual machines.
Types of machines to monitor
This guide includes monitoring of the following types of machines using Azure Monitor. Many of the processes described here are the same regardless of the type of machine. Considerations for different types of machines are clearly identified where appropriate. The types of machines include:
- Azure virtual machines.
- Azure Virtual Machine Scale Sets.
- Hybrid machines, which are virtual machines running in other clouds, with a managed service provider, or on-premises. They also include physical machines running on-premises.
Virtual machine monitoring layers
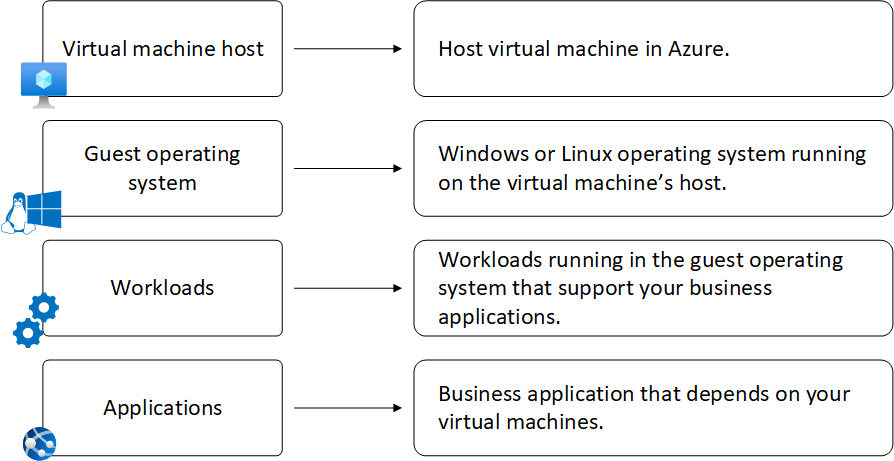
A virtual machine has four monitoring layers, each with a distinct set of telemetry and monitoring requirements.
| Layer | Description |
|---|---|
| Virtual machine host | The host virtual machine in Azure. Azure Monitor has no access to the host in other clouds but must rely on information collected from the guest operating system. The host can be useful for tracking activity such as configuration changes, and basic alerting such as processor utilization and whether the machine is running. |
| Guest operating system | The operating system running on the virtual machine, which is some version of either Windows or Linux. A significant amount of monitoring data is available from the guest operating system, such as performance data and events. You must install Azure Monitor Agent to retrieve this telemetry. |
| Workloads | Workloads running in the guest operating system that support your business applications. Workloads generate performance data and events similar to the operating system. You must install Azure Monitor Agent to retrieve this telemetry. |
| Application | The business application that depends on your virtual machines. Application Insights monitors the business application. |
VM monitoring configuration steps
The following table lists the different steps for configuration of VM monitoring. Each one links to an article with the detailed description of that configuration step.
| Step | Description |
|---|---|
| Deploy Azure Monitor Agent | Deploy Azure Monitor Agent to your Azure and hybrid virtual machines to collect data from the guest operating system and workloads. |
| Configure data collection | Create data collection rules to instruct Azure Monitor Agent to collect telemetry from the guest operating system. |
| Analyze collected data | Analyze monitoring data collected by Azure Monitor from virtual machines and their guest operating systems and applications to identify trends and critical information. |
| Create alert rules | Create alerts to proactively identify critical issues in your monitoring data. |
| Migrate management pack logic | General guidance for translating the logic from your System Center Operations Manager management packs to Azure Monitor. |
VM insights
VM insights is a feature in Azure Monitor for monitoring your virtual machines. While you don't need it to take advantage of most Azure Monitor features for monitoring your VMs, it provides the following value:
- Simplified onboarding of Azure Monitor Agent to enable monitoring of a virtual machine guest operating system and workloads.
- Preconfigured data collection rule that collects the most common set of performance counters for Windows and Linux.
- Predefined trending performance charts and workbooks for analyzing core performance metrics from the virtual machine's guest operating system.
- Optional collection of details for each virtual machine, the processes running on it, and dependencies with other services.
- Optional dependency map that displays interconnected components with other machines and external sources.
The articles in this guide provide guidance on configuring VM insights and using the data it collects with other Azure Monitor features. They also identify alternatives if you choose not to use VM insights.
Security monitoring
Azure Monitor focuses on operational data, while other services such as Microsoft Defender for Cloud and Microsoft Sentinel perform security monitoring in Azure. This guide doesn't include configuration of these services. The security services have their own cost independent of Azure Monitor. Before you configure these services, refer to their pricing information to determine your appropriate investment in their usage.
The following table lists the integration points for Azure Monitor with the security services. All the services use the same Azure Monitor Agent, which reduces complexity because you don't deploy other components to your virtual machines. Defender for Cloud and Microsoft Sentinel store their data in a Log Analytics workspace so that log queries can correlate data collected by the different services. Or create a custom workbook that combines security data and availability and performance data in a single view.
See Design a Log Analytics workspace architecture for guidance on the most effective workspace design for your requirements taking into account all your services that use them.
| Integration point | Azure Monitor | Microsoft Defender for Cloud |
Microsoft Sentinel |
Microsoft Defender for Endpoint |
|---|---|---|---|---|
| Collects security events | X1 | X | X | X |
| Stores data in Log Analytics workspace | X | X | X | |
| Uses Azure Monitor Agent | X | X | X | X |
1 Azure Monitor Agent can collect security events but sends them to the Event table with other events. Microsoft Sentinel provides additional features to collect and analyze these events.
Important
Azure Monitor Agent is in preview for some service features. See Supported services and features for current details.
Troubleshoot VM performance issues with Performance Diagnostics
The Performance Diagnostics tool helps troubleshoot performance issues on Windows or Linux virtual machines by quickly diagnosing and providing insights on issues it currently finds on your machines. The tool does not analyze historical monitoring data you collect, but rather checks the current state of the machine for known issues, implementation of best practices, and complex problems that involve slow VM performance or high usage of CPU, disk space, or memory.