Note
Access to this page requires authorization. You can try signing in or changing directories.
Access to this page requires authorization. You can try changing directories.
Applies to: ✅ Power BI Desktop and Power BI service
Power BI report themes let you apply design changes to your entire report. You can change theme colors, set default visual formatting, and define custom style presets. When you apply a report theme, all visuals in your report use the colors and formatting from that theme as their default style.
You can use the formatting pane to format individual visuals. When formatted individually on the report canvas, the custom theme doesn't override those changes until you reset the visual to default.
To select report themes:
- In Power BI Desktop, go to the View ribbon. In the Themes section, select the dropdown arrow.
- In the Power BI service, select View > Theme.
From the dropdown, select the built-in theme you want, browse for a custom theme file, or customize the current theme.
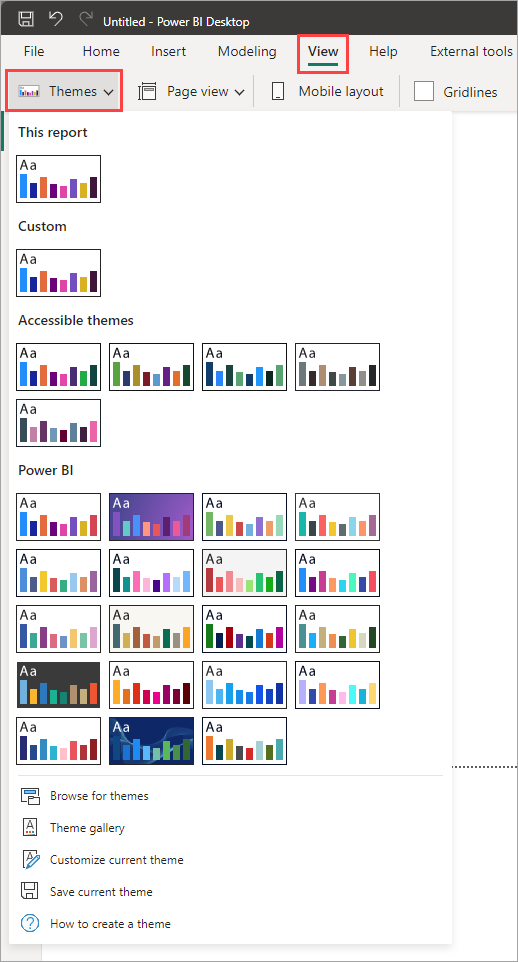
The upper section shows:
- Built-in report themes provide different kinds of predefined themes.
- Organizational report themes appear in the dropdown when your tenant admin makes additional custom report themes available.
The lower section shows:
- Browse for themes to find a report theme file you downloaded to use in this report.
- Theme gallery takes you to the community site where you can find report themes to download.
- Customize current theme lets you adjust or create a current theme for this report. Selecting this option opens a dialog where you can specify different colors, fonts, visual background styles, page background and wallpaper styles, and the filter pane style. When we make updates to our base theme, or the default look of reports without a custom theme specified, a banner shows in this dialog to update the base theme of existing reports using the base theme from when the report was created.
- Save current theme lets you export the custom theme of this report so you can share it with others, make further modifications to it in a text editor, or use it in another report.
- How to create a theme navigates you to this documentation.
Note
The lower section of the Themes dropdown is only available in Power BI Desktop. When editing reports in the Power BI service, you can only see the upper section (built-in and organizational themes).
Understand how the report uses themes
Every report has a base theme defining the default colors and style used across all visuals. The styles include common styles across visuals, such as border, padding, and title font, and styles specific to visuals types, such as line style for line charts. Power BI adds the base theme when you create a report. New releases might update the base theme, but your report keeps its original base theme until you update it. The base theme is what is used for the default style of any new visual created. Microsoft manages the base theme as part of Power BI.
Individual visuals can be formatted differently using the format pane. You can pick another color from the theme colors or a color not in the theme colors. You can deviate from the theme on padding or title font, for just that visual. To revert the style of a visual back to the theme style, you can reset to default for the entire visual, or formatting section on that visual.
Note
Reset to default also removes formatting pane items controlling actions on buttons and images, all conditional formatting rules, images from URLs or data-bound fields, and other data-bound items such as reference labels.
If you want to modify the colors and styles for an entire report, including existing visuals and new visuals, you use a custom theme. The custom theme layers on top of the base theme, letting you override or add to any style or color defined in the base theme, including style presets for specific visual types.
With a custom theme applied, reset to default reverts a visual to the custom theme style, and for anything not defined in the custom theme, the base theme style. Custom themes can be created or modified in a limited way in Power BI Desktop and created or modified extensively in the JSON theme file. You can export any report's custom theme as a file for use in another report, and add a custom theme to a report by browsing for the JSON theme file.
Custom themes are also called report themes.
Understand how theme colors are used by the report
Theme colors are used when you create any visuals in the report. The colors come from data colors in the theme. When you edit any color element in a visual, the dialog shows you the theme colors with various shades of those colors to pick from. You can also select More colors to pick any color you need.
It's best practice to use the theme colors. When you pick a theme color and then change the theme later, the visuals update to the new theme colors automatically. To avoid having to manually update every visual to new colors on a theme update, pick theme colors.
The colors in the color palette are relative to the current theme. For example, suppose you select the third color of the top row for a data point. If you change to a different theme, that data point's color automatically updates to the third color of the top row in the new theme. This behavior is similar to changing themes in Microsoft Office.
If you prefer a visual to not automatically update, don't use a theme color by going to more colors in the color palette. To return any visual to the theme colors, choose reset to default in the visual's formatting pane.
You can also reference theme colors by name in DAX measures for conditional formatting. When you use Field value format style, return the theme color name (like good, bad, or neutral) from your measure, and the visual uses the corresponding color from the current theme. For more information, see Named theme colors.
Colors used by dynamic and static series in visuals
When a visual has a series, Power BI applies colors in the order they appear in the theme's data colors. A visual has a series when you add a legend or use more than one measure in the values section.
A dynamic series is when you add a column to a legend or axis that then shows the series per value. These values are dynamic in that a column can have any number of values and the values may change based on interactions within the report, such as filters applied and slicer selections.
For example, if you show Profit by Region in a visual, you might have two sales regions, or you might have four or a different set of regions. The number and selected set of regions is dynamic, making this a dynamic series.
A static series is when you add more than one measure, or stack, measures in the field well of a visual. For static series, you control the number of members in the series and their order. For example, Profit and Revenue measures used in a visual are a static series.
Colors are assigned to the value of the series by the order they appear in the visual. The first theme color is assigned to the first in the series, and second theme color is assigned to the next, etc.
In the dynamic series example, if I have a visual showing Profit by North and South region, and another visual showing it by East and North regions, then the first values, North and East use the first color, and South and North use the second color. North has a different color as it's used in a different order in the visuals.
In the static series example, if I have Profit then Revenue in one visual, and Revenue then Profit in another visual, the colors are different.
You can always assign specific members of a series to a particular theme color by using the formatting pane: see more information about how to change the color of a single data point.
Visual level color assignment can be undone at any time by choosing reset to default on the particular formatting pane section for that visual, and the visual again automatically uses the theme colors in the order the series members appear in the visual.
Apply a built-in report theme
Built-in themes let you quickly apply a custom theme to your report. Any report custom theme previously added or adjusted in the report is replaced with what you select. Visuals formatted directly using the format pane maintain their customizations until you reset them to default.
- On the View ribbon, select the dropdown arrow next to Themes .
- Select from the themes on the dropdown menu.
The report theme is now applied to the report.
Built-in report themes available
The following table shows the available built-in report themes.
| Built-in report theme | Default color sequence |
|---|---|
| Reset to default | Removes any custom theme and reverts the report to the base theme. |
| Bloom |

|
| Divergent |

|
| Frontier |

|
| Innovate |

|
| Tidal |

|
| Copilot default | The theme Copilot uses when it generates report content. |
Note
If your tenant uses organizational themes, you can specify which theme Copilot uses by default instead.
Apply an organizational report theme
More themes may be available in the theme dropdown if your tenant admin adds them to organizational themes. These themes are applied like the built-in themes; they remove any previous custom theme and use the selected custom theme.
Customize the current report theme
You can customize colors, text, visual properties, page settings, and the filter pane for the current report directly from the Theme pane in Power BI Desktop or the Power BI service. For details, see Visual defaults in Power BI reports.
For finer control, you can also modify the custom theme's JSON file in a text editor such as VS Code and browse for the theme file to add it to the report.
Manage the base report theme
The base theme is the underlying default styling that Power BI applies before any customizations. When you apply a custom theme, it layers on top of the base theme. Power BI might update the base theme with new releases, but existing reports keep their original base theme until you update it.
For more information about available base themes and how to update or change your base theme, see Visual defaults in Power BI reports.
Save a report theme file
You can export the currently applied report theme to a JSON file from Power BI Desktop or the Power BI service. After you export a report theme, you can reuse it in other reports.
To export the currently applied theme:
- On the View ribbon, toggle on the Theme pane.
- Expand Theme settings.
- Select Export theme to save your theme as a
JSONfile.
Apply a custom report theme JSON file
You can apply custom theme JSON files that you save from another report or that someone else shares with you to any other report in Power BI Desktop or the Power BI service.
To import a custom theme JSON file:
- On the View ribbon, toggle on the Theme pane.
- Expand Theme settings.
- Select Import theme and choose the
JSONfile.
When successful, Power BI shows a dialog that the import was successful. A dialog also shows when it isn't successful with details on the error in the custom theme file.
Tip
To find theme files created by others, browse the themes gallery and download a theme to your machine. You can also use online tools or a text editor such as VS Code to create your own or edit an existing custom theme file.
Custom report theme files you can use right now
Want to get started with report themes? Browse the themes gallery for custom themes. You can also download and import the following JSON files into your Power BI Desktop report:
Waveform theme. This report theme was introduced in the blog post that announced the first release of report themes. Download Waveform.json.
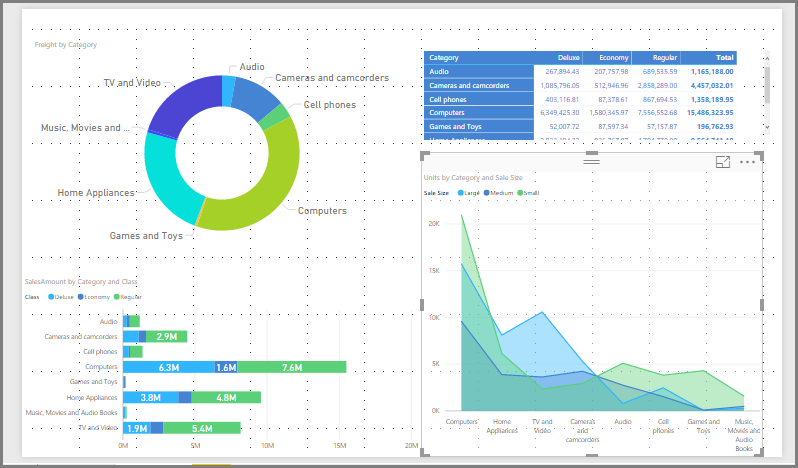
Color-blind friendly theme. This report theme is easier to read for the visually impaired. Download ColorblindSafe-Longer.json.
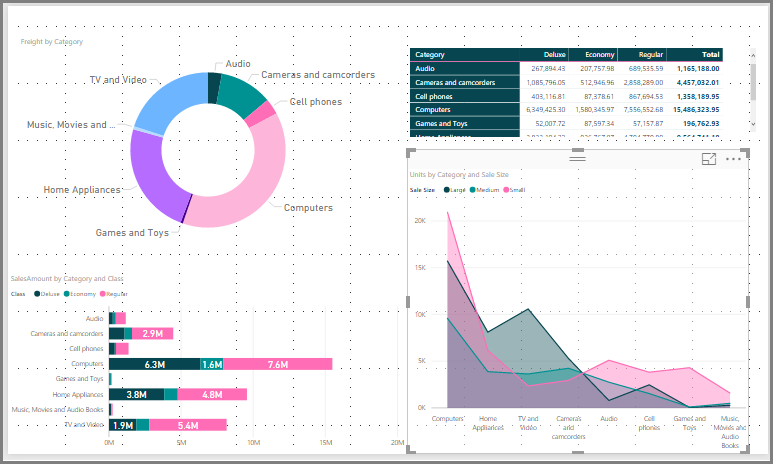
Valentine's Day theme.
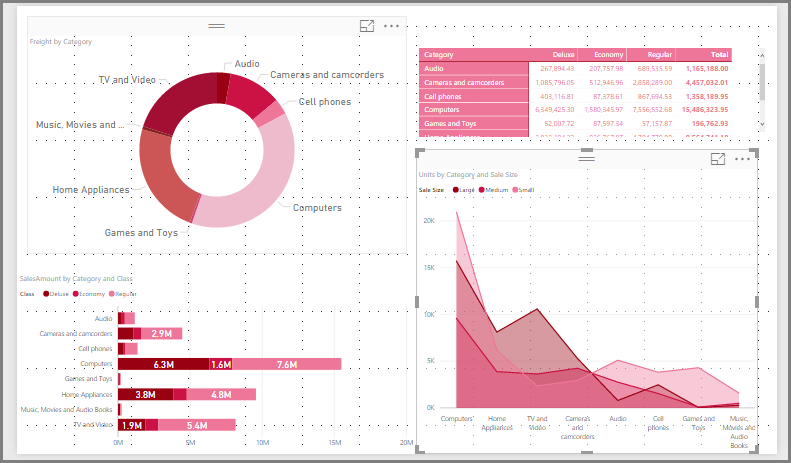
Here's the code for the Valentine's Day JSON file:
    {
        "name": "Valentine's Day",
        "dataColors": ["#990011", "#cc1144", "#ee7799", "#eebbcc", "#cc4477", "#cc5555", "#882222", "#A30E33"],
        "background":"#FFFFFF",
        "foreground": "#ee7799",
        "tableAccent": "#990011"
    }
Here are a few more report themes you can use as starting points:
Report themes can make your Power BI Desktop reports a colorful reflection of you, your organization, or even the current season or holiday.
More sources of report themes
The following GitHub repository has sample JSON for all the different components in the JSON themes file: Power BI Theme Templates.
In addition, try searching for "Power BI theme generator" on Bing.
Create a custom theme file
To create your own custom report theme JSON files with complete control over colors, fonts, and visual styles, see Create custom report themes in Power BI Desktop.
Considerations and limitations
- Applying a built-in theme removes any customizations you already added to the report.
- Importing a custom theme also removes any existing customizations you already added to the report.
- You can add more options to a custom theme when you edit the
JSONfile directly.